Do the CloudWatch Metric Math
“CloudWatch Metric Math makes it easy to perform math analytics on your metrics to derive additional insights into the health and performance of your AWS resources and applications.”
Use cases
Typical use case for metric math could be monitoring application error ratio for load balancer. It can be difficult to say if 5 or 10 errors in minute is something you want to be woken up from good night sleep, but if 5% of request end up with HTTP 5xx, then you want to get notified. Or you would want to get notified when your EFS filesystem is being utilized close to it’s maximum throughput, either because it ran out of burst credits or is simply utilized up to provisioned capacity.
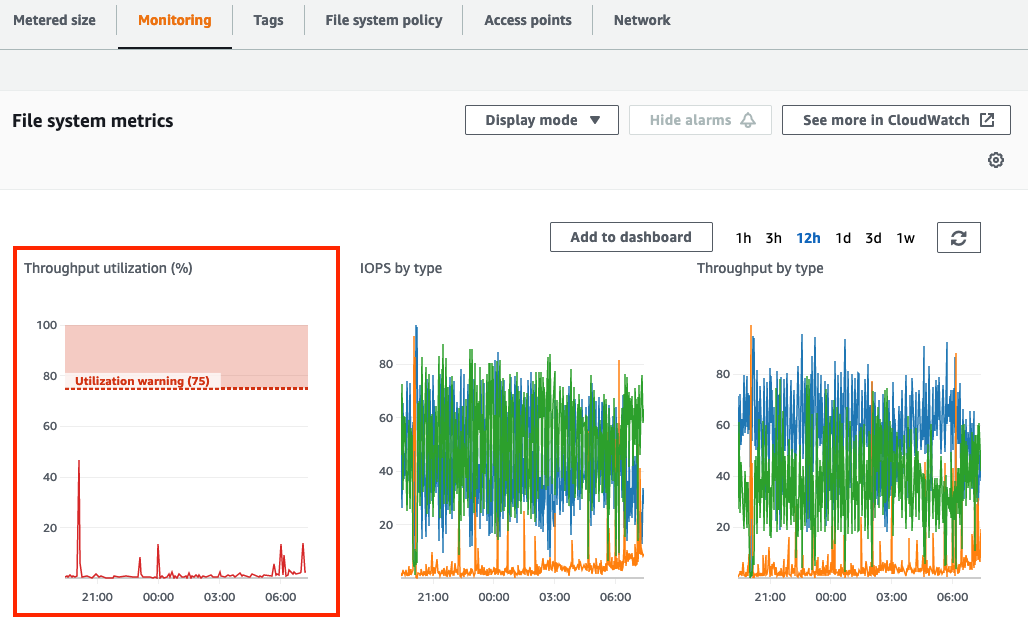
EFS throughput utilization
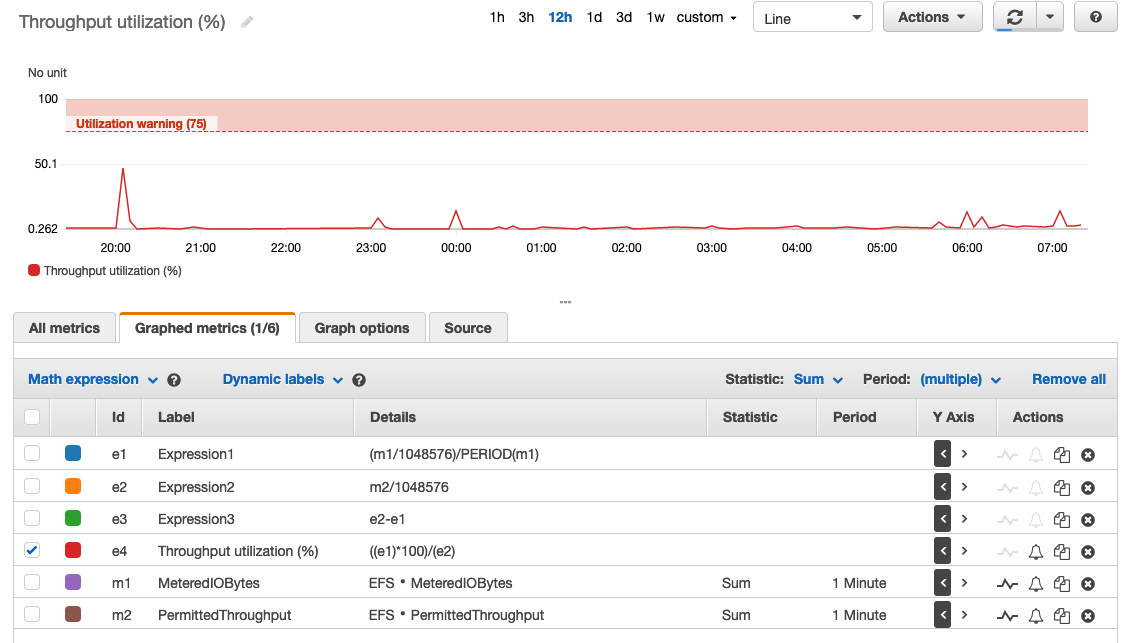
EFS dashboard has a graph for throughput utilization %, but this is not a native CloudWatch metric you can use for triggering an alert. If you open the graph in CloudWatch console can see how throughput utilization % is implemented.
Here you can see it has 2 metrics and 4 math expressions, but only e4 is shown in the graph. On closer look, e3 = e2 - e1 (available throughput) isn’t used for anything, and diving both m1 and m2 by 1048576 is redundant. All 4 expressions below can be then simplified to
- e1 = m1/PERIOD(m1)
- e4 = e1*100/m2
Cloudformation
Alert for utilizing >75% of EFS filesystem throughput can now be written in Cloudformation.
(complete template efs-throughput.yaml)
  HighEFSThroughput:
    Type: AWS::CloudWatch::Alarm
    Condition: EnableCloudwatch
    Properties:
      AlarmActions:
      - !Sub "arn:aws:sns:${AWS::Region}:${AWS::AccountId}:${SNStopic}"
      OKActions:
      - !Sub "arn:aws:sns:${AWS::Region}:${AWS::AccountId}:${SNStopic}"
      AlarmDescription: EFS throughput utilization is over 75% of maximum
      ComparisonOperator: GreaterThanThreshold
      Threshold: 75
      TreatMissingData: ignore
      EvaluationPeriods: 5
      Metrics:
        - Id: m1
          MetricStat:
            Metric:
              Dimensions:
                - Name: FileSystemId
                  Value: !Ref EFS
              MetricName: MeteredIOBytes
              Namespace: AWS/EFS
            Period: 60
            Stat: Sum
          ReturnData: False
        - Id: m2
          MetricStat:
            Metric:
              Dimensions:
                - Name: FileSystemId
                  Value: !Ref EFS
              MetricName: PermittedThroughput
              Namespace: AWS/EFS
            Period: 60
            Stat: Sum
          ReturnData: False
        - Id: e1
          Expression: m1/PERIOD(m1)
          Label: Throughput bytes/s
          ReturnData: False
        - Id: e4
          Expression: e1*100/m2
          Label: Throughput utilization (%)
          ReturnData: True
Nothing special in m1 or m2. These are standard Cloudwatch metric definitions.
Expressions e1 and e4 are also just as you would expect them to be. PERIOD(m1)
is way of getting bytes/s from sum of throughtput utilized during a period of time,
in this case 1 minute. See metric math documentation for other functions that
can be used in expressions.
NOTE1: Only one of Metrics can have ReturnData: True. This is
the one CloudWatch is monitoring and can trigger the alarm. Other stats
and expressions are (indirect) inputs of it.
NOTE2: Metric Id must begin with lower-case letter. Non-compliant
metric id will cause this cryptic error message when you try to create or update
the resource.
Invalid metrics list (Service: AmazonCloudWatch; Status Code: 400;
Error Code: ValidationError; Request ID: 11111111-1234-5678-abcd-ab1234567890; Proxy: null)
Resources
- EFS Tutorial includes CloudWatch dashboard for EFS implemented in Cloudformation