Debugging Lambda
Nowadays you should always ask your friendly LLM first. So I did.
What is the best way to debug AWS Lambda functions?
Answer was a long list of advice including test events, logging, AWS X-Ray, and running
functions locally on your laptop using sam local or LocalStack.
While all great advice, all of those require rather complex setup and don’t really let you debug
code in its native environment (to avoid works-on-my-machine -syndrome). While setup could be
justified for full-time dev(ops), it isn’t really feasible when you are on-duty and suddenly pulled
into debugging a function that you have never seen before.
Fortunately there is a way to debug ad-hoc lambda functions running in their native environment, with minimal setup.
Lambda Remote Debugging
This is the new feature my chatbot wasn’t aware of (yet)
AWS Lambda now supports remote debugging in Visual Studio Code (VS Code), enabling developers to debug their Lambda functions running in the cloud directly from their local IDE. With this new capability, developers can use familiar debugging tools like breakpoints, variable inspection, and step-through debugging with functions deployed in the cloud without modifying their existing development workflow, thus accelerating their serverless development process.
Wow! Also the list of pre-requirements for remote debugging doesn’t look too bad for casual debugger, especially when compared to any of above options.
- VS Code
- AWS Toolkit
- AWS Credentials
Getting started
To get started you just browse to AWS Lambda Console, find your function and click.
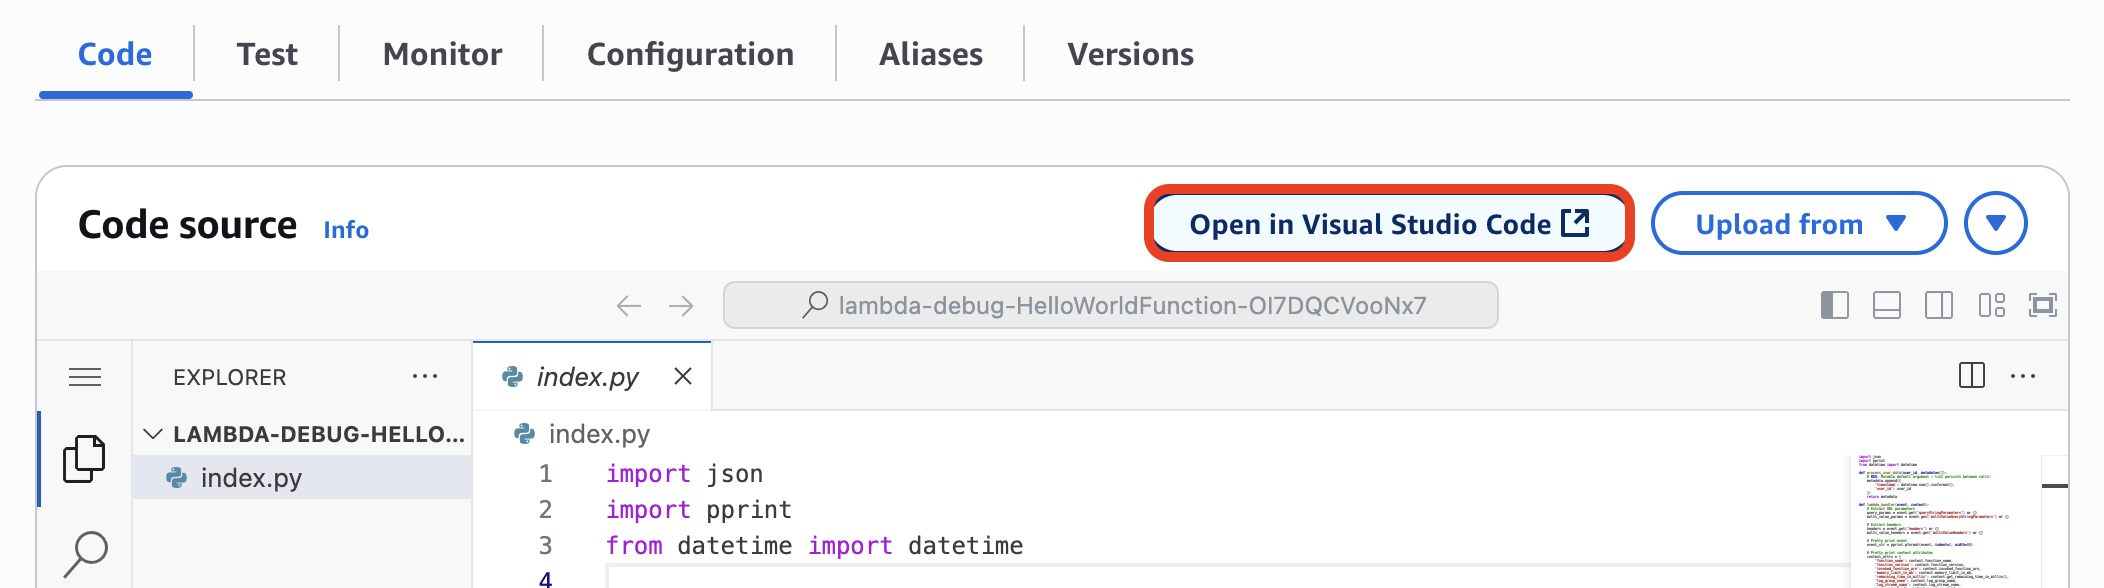
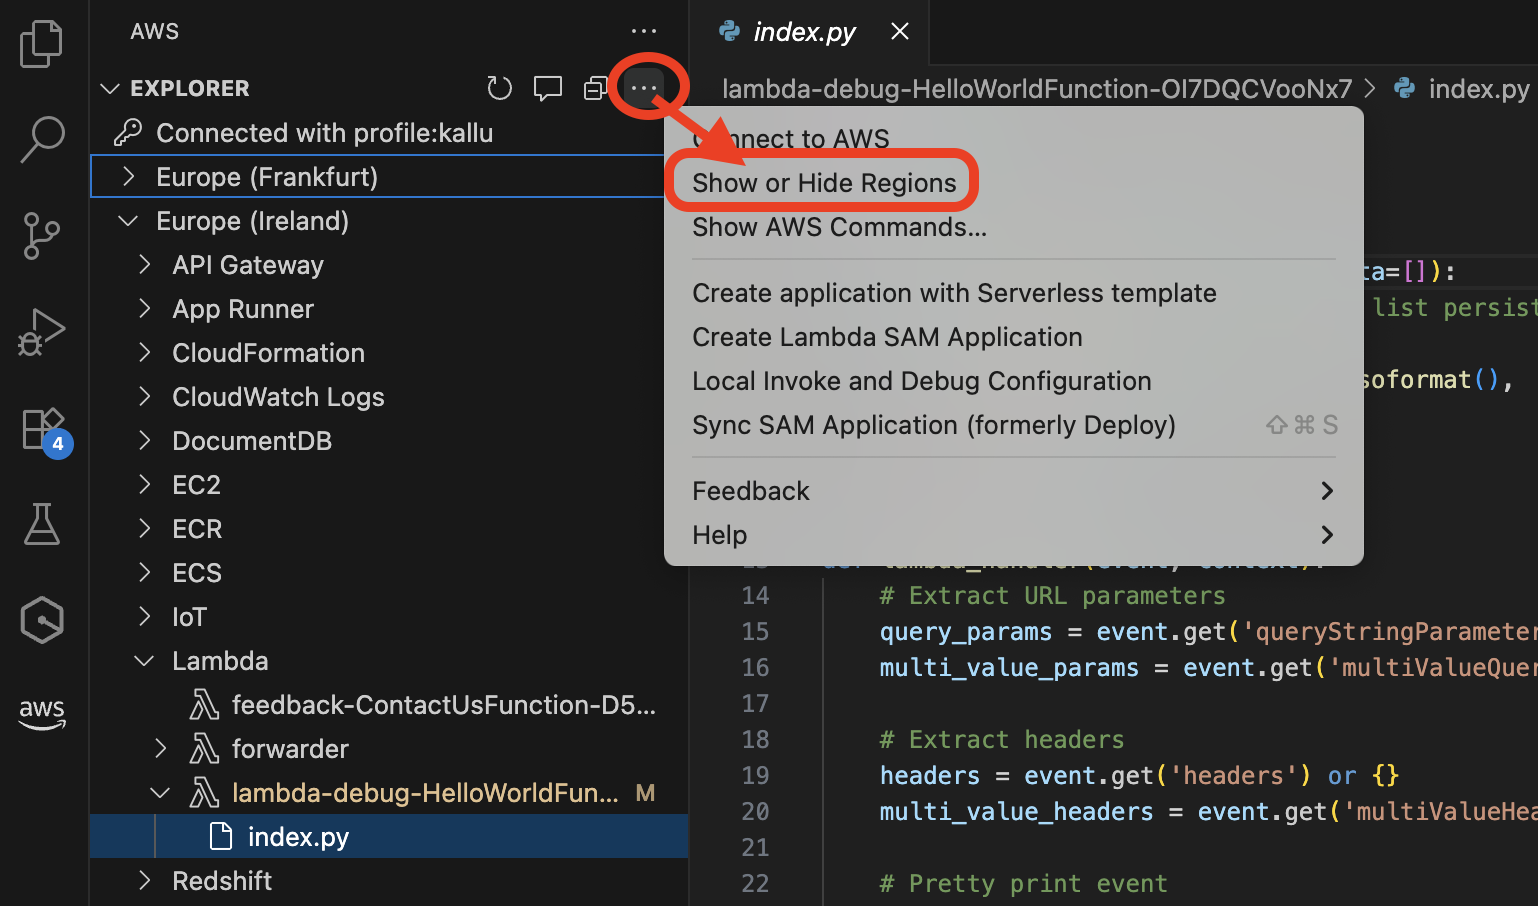
This will open the function in your VS Code and if you don’t have recent version of AWS Toolkit, it will take care of that too. For now AWS Console can only open VS Code, but actually any VS Code derivative like Kiro will work. Important part is AWS Toolkit. You can also open debugging session from your editor and select the function from AWS Toolkit Explorer. By default you will see only the default region configured for your credentials. If you don’t see the function you were looking for, verify you have enabled the correct region.
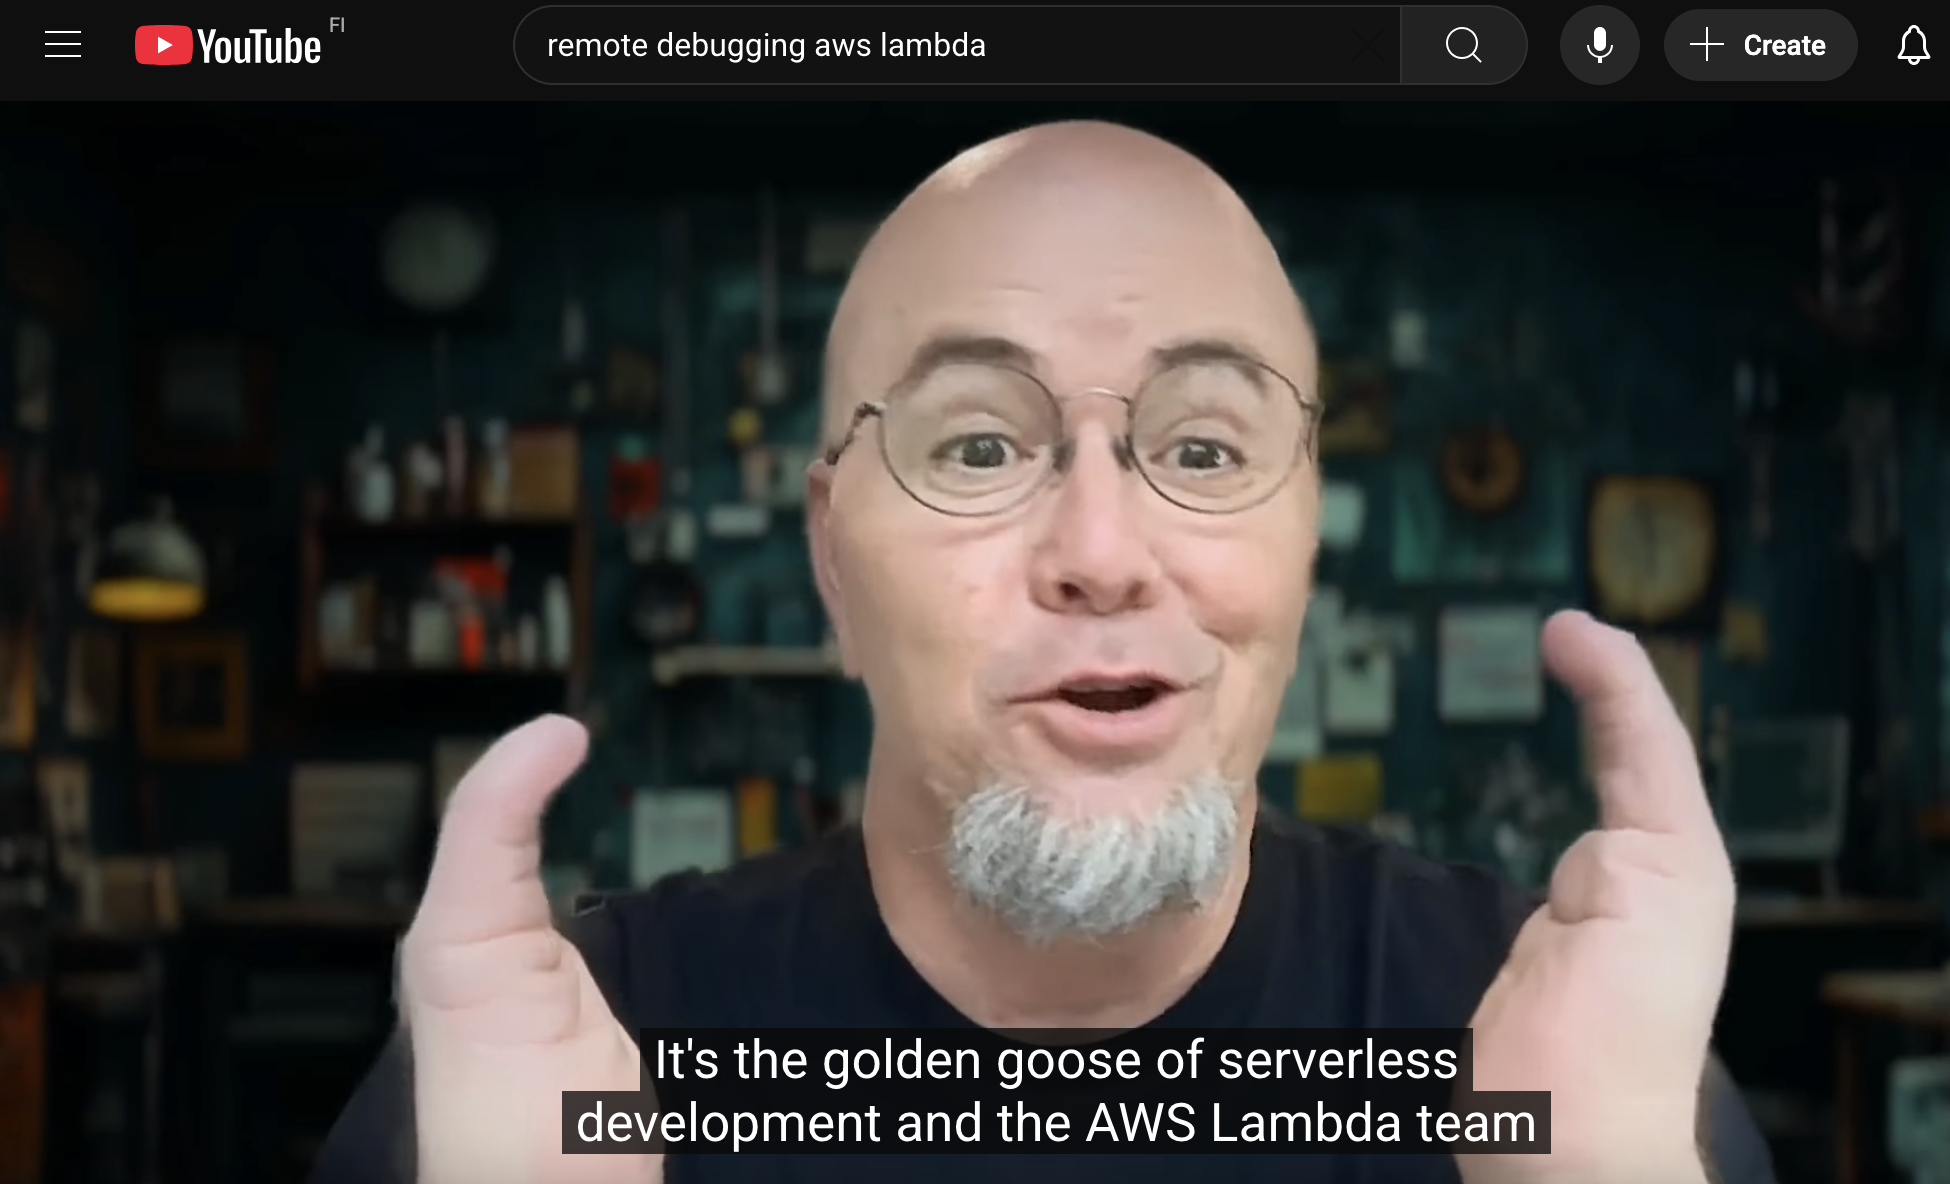
I’d also recommend you to spend 5 minutes and watch Eric Johnson’s demo below.
Debug this
Sometimes seeing is believing, but nothing beats getting hands-on. For this I created a template that creates a sample python function with a bug. You can get the template from github -repo and deploy it with AWS CLI or from AWS CloudFormation console. Code and minimal infrastructure are both included in single file for easy deployment.
% aws cloudformation deploy --template-file template-bug.yaml --stack-name lambda-debug-demo --capabilities CAPABILITY_AUTO_EXPAND CAPABILITY_IAM CAPABILITY_NAMED_IAM
And then get the function URL from stack outputs using AWS CLI or from AWS CloudFormation console
% aws cloudformation describe-stacks --stack-name lambda-debug-demo --query 'Stacks[0].Outputs[].[Description,OutputValue]'
[
    [
        "Lambda Function URL",
        "https://LAMBDA-FUNCTION-URL.lambda-url.eu-west-1.on.aws/"
    ],
    [
        "Hello World Lambda Function ARN",
        "arn:aws:lambda:eu-west-1:123456789012:function:lambda-debug-HelloWorldFunction-OI7DQCVooNx7"
    ]
]
If you now call plain function URL https://LAMBDA-FUNCTION-URL.lambda-url.eu-west-1.on.aws/ or with URL parameter user_id=foo you can see how the value from from process_user_data() keep growing after each call.
Lambda Function Debug Info
=============================

BUG DEMONSTRATION - Mutable Default Argument:
Notice how the list keeps growing between calls!
process_user_data() returns:
[{'timestamp': '2025-07-25T18:27:55.517622',
  'user_id': 'anonymous'},
 {'timestamp': '2025-07-25T18:28:06.864674',
  'user_id': 'anonymous'},
 {'timestamp': '2025-07-25T18:28:21.197582',
  'user_id': 'foo'}]
But looking at the code, it should only return info about current call
    def process_user_data(user_id, metadata=[]):
        # BUG: Mutable default argument - list persists between calls!
        metadata.append({
            'timestamp': datetime.now().isoformat(),
            'user_id': user_id
        })
        return metadata
I will leave fixing this for reader to test debugging and your favorite LLM. Or you can check debug.md.
Things to consider
While remote debugging of Lambda functions is a great feature it doesn’t come without some limitations.
1) At the moment it works with recent Python, Node.js and Java functions. 2) Debugging attach an extra
layer to function. This will add about 40MB on top of functon total size that must remain within limit
of 250MB. 3) Connection from remote function to AWS Toolkit running in local IDE is established using
IoT tunnel. If you have strict least privilege IAM policies, it might be necessary to add permission
for iot:OpenTunnel for credentials you use in AWS Toolkit.
And finally, eventhough Lambda remote debugging is marketed as developer feature, I think it also has a lot of value for the Ops in devops as it allows ad-hoc debugging with minimal pre-requirements.